Development environment
OS: Mac os X 10.95
Python: 2.7
Django: 1.9.4
Database: Mysql
Bootstrap: 3.3.0
Jquery: 2.0.0
Highcharts: 5.0.2
Introduction
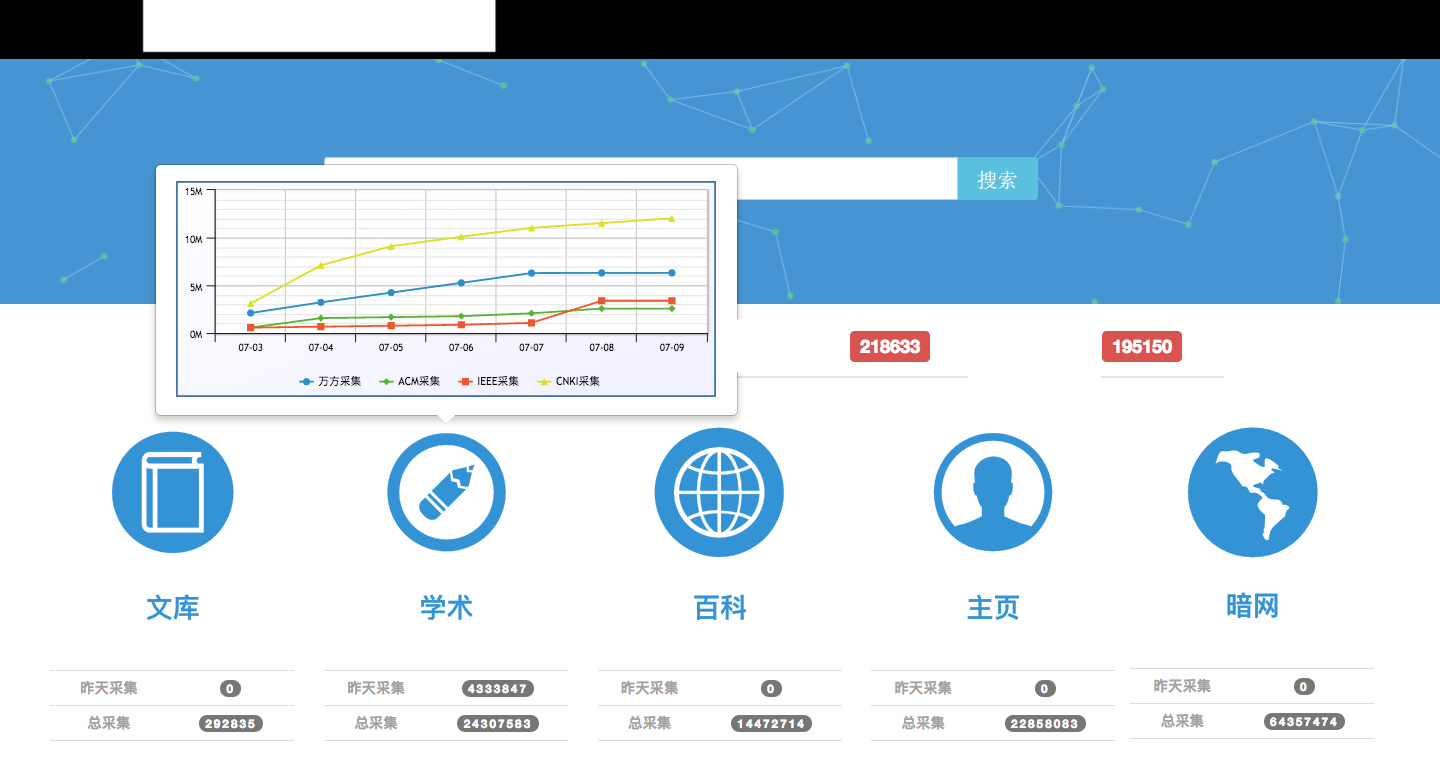
In recent project, we need collect academic information from online academic databases. We developed an distributed web crawler. In order to real-time monitor the quantity and the trend of the data collected, I made an webpage to display these informations.

System description
To ensure intuitiveness, comparability and real time, I adopt the following strategies:
- each kind of crawling task is placed in one line chart; x-axis represents the quantity of data collected; y-axis represents date;
- line chart will be popped up when mouse hovers on the appropriate icon;
- every hovering will trigger an AJAX request, which ensures the data is the latest.
Limitation
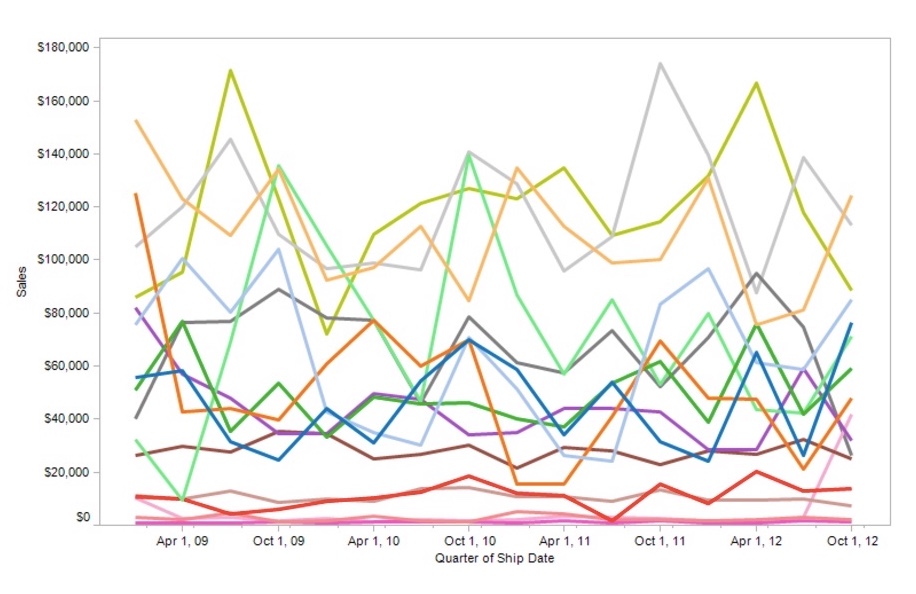
As shown in the Fig. 4, when there are too many categories in the line chart, the chart will be very cluttered.

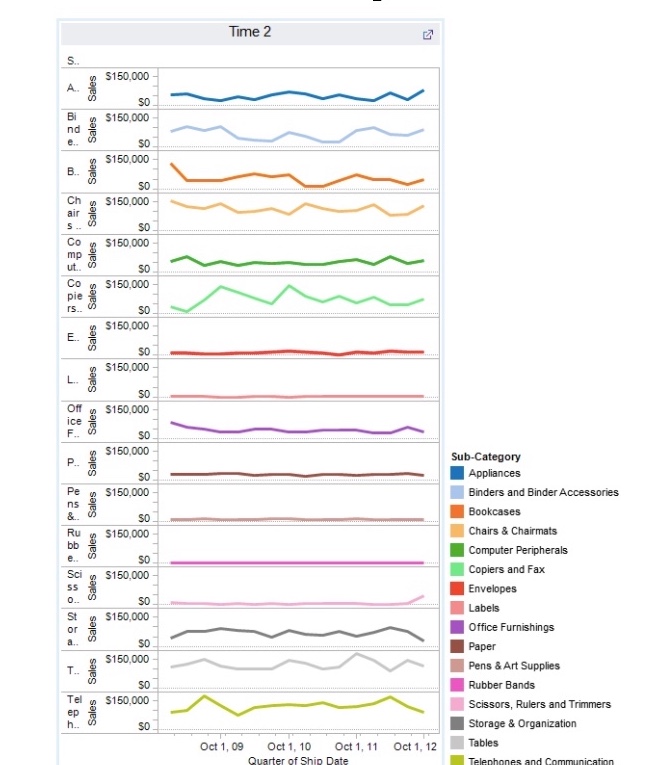
There is one solution that we can use Small Multiples Time Chart.

References
1.Course Diary #1: Basic Charts

