1 Introduction
Recently, our group is working on visual relevance analysis to discover related academic information. It is important for researchers to discover related academic information when they are acquiring knowledge about a specific field, which can help them to find new ideas for research. Several platforms are available for discovering related academic information such as Google Scholar, Springer. However, they are not intuitive to represent related academic information. In this article, we proposed a visual relevance analysis system based on a Semantics-based information modeling. We mainly focus on:
- Building an academic knowledge base (AKB) for academic information;
- Developing Information search system for AKB;
- Researching the method of the demonstration system of knowledge-based entity relations.
2 Building Academic knowledge Base
We employ the ontological approach to building the AKB.
2.1 Ontology Description of AKB
Creation of ontology for the academic domain we have defined three top classes listed below:
-
Publications: Publications class categories into three different subclasses: Journals, Conferences, Dissertations. Publications’s details include “Title”, “Authors”, “Abstract”, “keywords” etc.
-
Scholars: Includes set of all author’s information. Author’s information includes general details of authors, like “Name”, “Email address”, “Affiliation” etc.
-
Organizations: Organizations contain all affiliations of publications’ authors. Organizations’s details include “Name”, “Location”, “Description” etc.
2.2 Relations in AKB
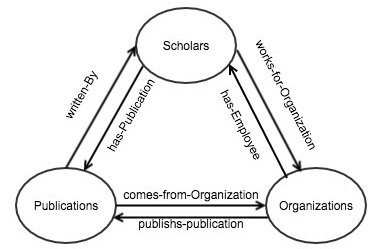
We define six relations which include has-Publication, written-By, works-for-Organization, has-Employee, comes-from-Organization, publish-publication in our AKB. The Fig. 1 depicts the relations between classes.
2.3 Ontology Entities
This section describes how to create entities for the AKB ontology.
-
For Publications: We crawled 586,596 webpages from online Chinese academic databases such CNKI, WanFangData. We extracted the publication’s information (e.g. title, authors, abstract, keywords, organizations, etc.) from those webpages to create entities for publication’s class.
-
For Scholars: We can obtain authors’ basic information (e.g. name, affiliation) from publications and use author’s information to create entities for scholar’s class.
-
For Organizations: Similarly to Scholars, we can extract Organizations’ basic information (e.g. name) from publications to generate entities for organization’s class.
2.4 Building Relations Between Entities
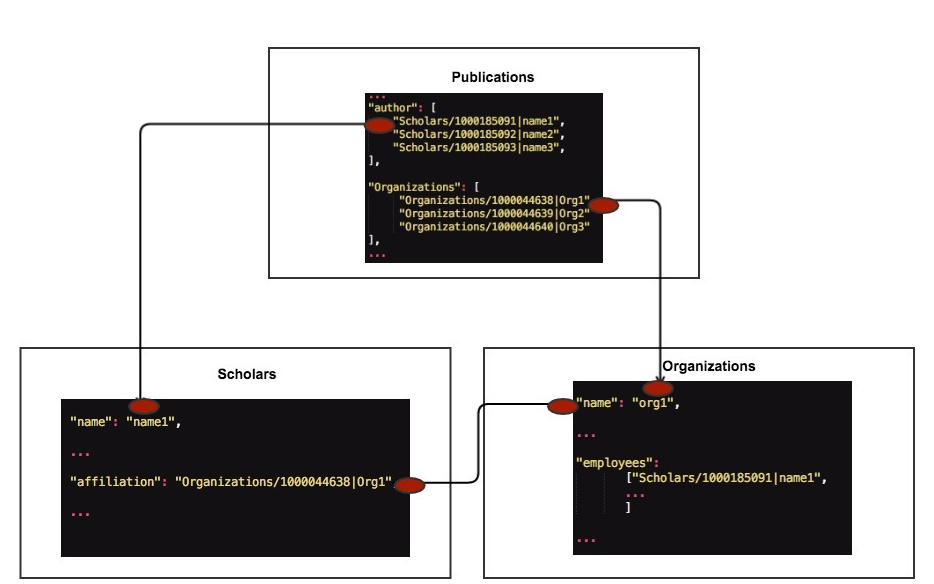
It is one of the most important steps for realizing visual relevance analysis to build relations between entities. Already mentioned earlier, our AKB consists three main classes and six relations. Like extracting entities, we also can extract relations from the publication’s information. Each entity is assigned a globally unique ID. We establish relations through the properties of publications’ information such as authors, organizations. Fig. 2. shows the details.
3 System description
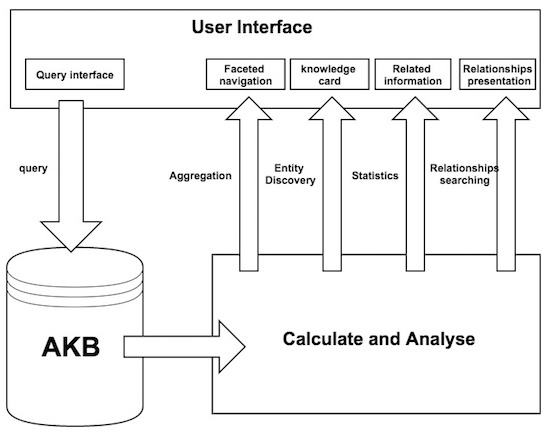
In this section, I describe the overview of our visual related analysis system. Fig. 3 shows the architecture of the system. This system consists of three main components.
3.1 Academic knowledge base (AKB)
AKB provides the ontological representation of scientific research in the field of academy. These information include Publications, scholars and organizations. Details description about AKB present in Section 2.
3.2 Calculate and Analyze (CAA)
This module provides supports for visual relevance analysis related to a given query. CAA’s details are explained in Section 3.3.
3.3 User interface
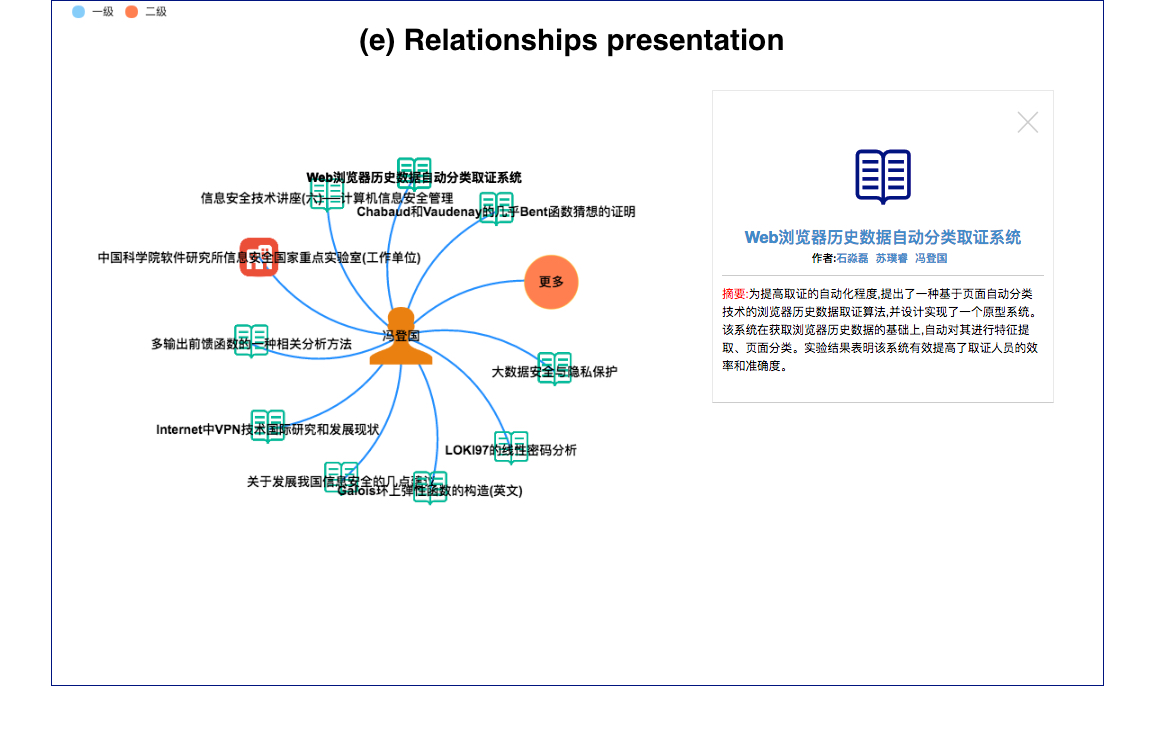
The user interface provides an interactive GUI to allow the user to discover related academic information with an intuitive way. It consists of five main parts, as shown in Fig. 4, (a) Query interface, (b) Faceted navigation, (c) Knowledge card, (d) Related information, (e) Relations presentation.
3.3.1 Query interface
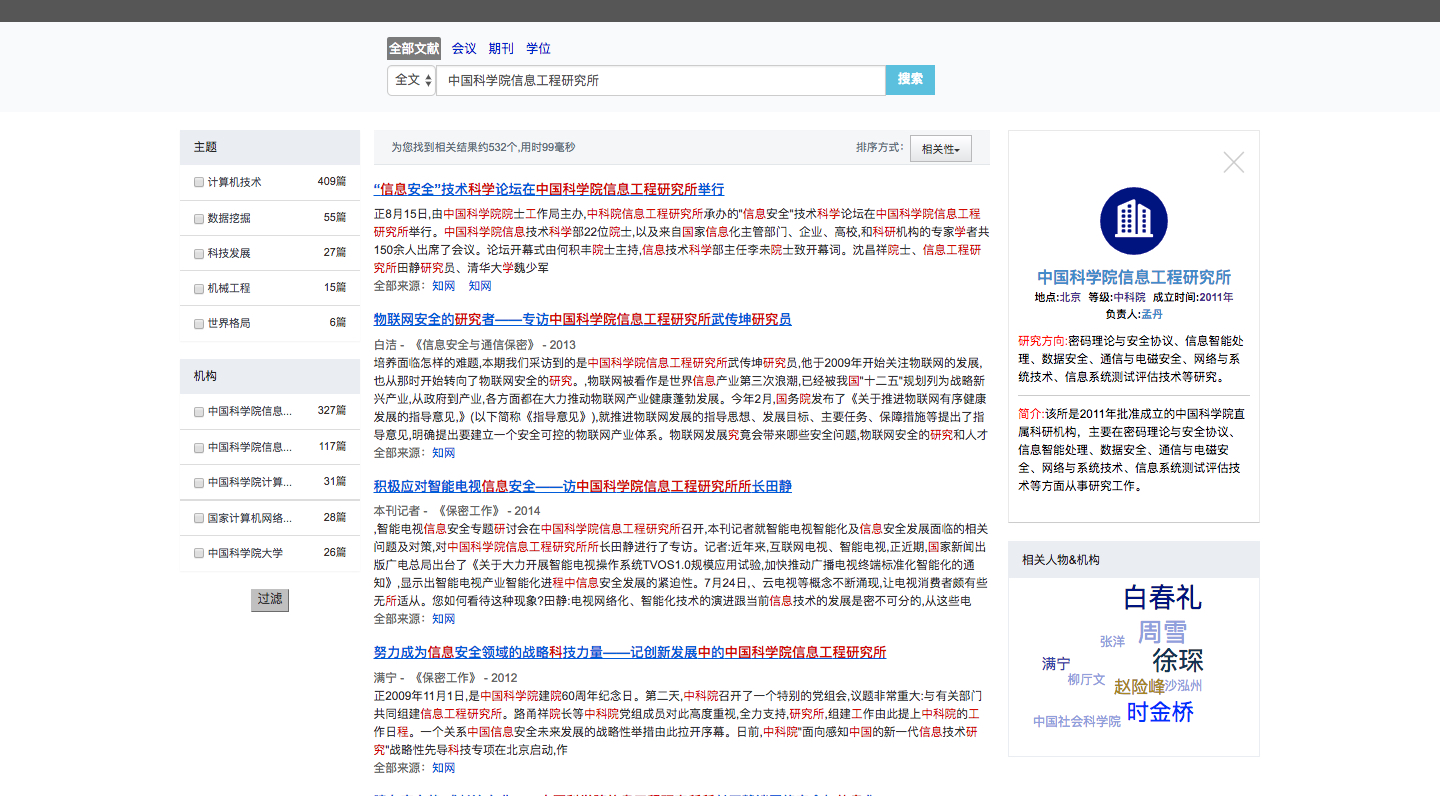
The Query interface allows the user to generate queries by entering keywords and selecting search scopes. As shown in Fig. 5, the Query interface contains four sections: search scopes, search fields, input box and sort menu. The search scopes is used to select the type where the user can access such as Journals, Conferences, Dissertations and all of them. The search fields provides some fields (e.g.title, authors, abstract, organizations, etc.) where the keywords will be matched. The sort menu allows the user to sort the results by certain rules. Currently, this system can provide two ways of sorting, (1) relevance, (2) sensibility.

3.3.2 Faceted navigation
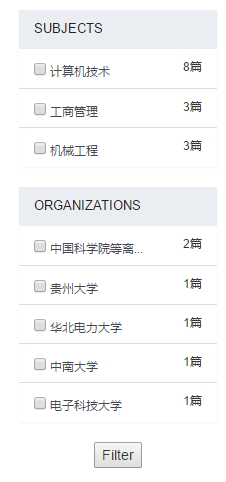
The Faceted navigation can not only show statistical distributions of the retrieved results but also let the user narrow down the results through interactive filter. When the user retrieves knowledge base by keywords, the system will compute the distribution of retrieved results on structured data, which can make the user get a whole picture of the results. In order to look into the results distributed in some fields, I add a checkbox on the front of each aggregation result. The user can select one or more checkbox to filter the retrieved results.
3.3.3 Knowledge card
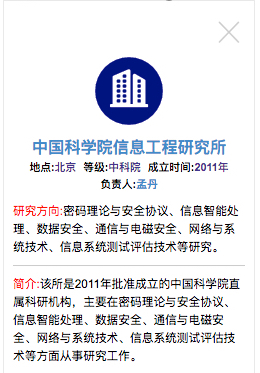
The purpose of adding a knowledge card is to provide a factual response to a query and show a different aspects related to a “single conceptual entity”. The concept of knowledge card stems from Google search, which can help the user to discovery more deeper information. In this system, the knowledge card contains some basic informations. For instance, a knowledge card for “INSTITUTE OF INFORMATION ENGINEERING, CAS” contains its location, level, establishment time, description, chief and research directions.
3.3.4 Related information
The related information presents related entities associated with the search results in a tag cloud. Once the result is generated, the system will produce a list of related entities. There are two steps. First is to collect the related entities of the first 100 search results. Second is to count the frequency of each related entity and single out related entities that have a high frequency.
3.3.5 Relations presentation
The relations presentation aims to intuitively display the relations between related entities, which will help the user discover new related information quickly and easily. This system uses Force-directed graph to visualize knowledge graph. Taking one entity as the core of the graph, other related entities will be automatically calculated and presented. When the mouse hover on one node, the knowledge card will display specified information related to the entity. The user can access to another relations graph through clicking the link on the knowledge card.
