1 Introduction
One month ago, we developed the prototype system of visual relevance analysis to help the user discover potential and relevant academic information. Although the previous system is available for basic functions such as retrieving academic knowledge base, discovering related entities, it has some limitations that need to be improved. I decide to redesign the visual relevance analysis system. In this article, I present my design ideas.
Compared to the previous system, the new system, ScholarEye, enhance the ability of interaction with users. As shown in Fig. 1, there are mainly five changes in the new version:
- Integrating all functions into a single analysis session (inspired by TextTile [1] );
- Introducing Meta-search Engine;
- Using drag-and-drop mechanism;
- Improving the representation of entity relationship diagram;
- Adding operable panel for each node.
2 System description
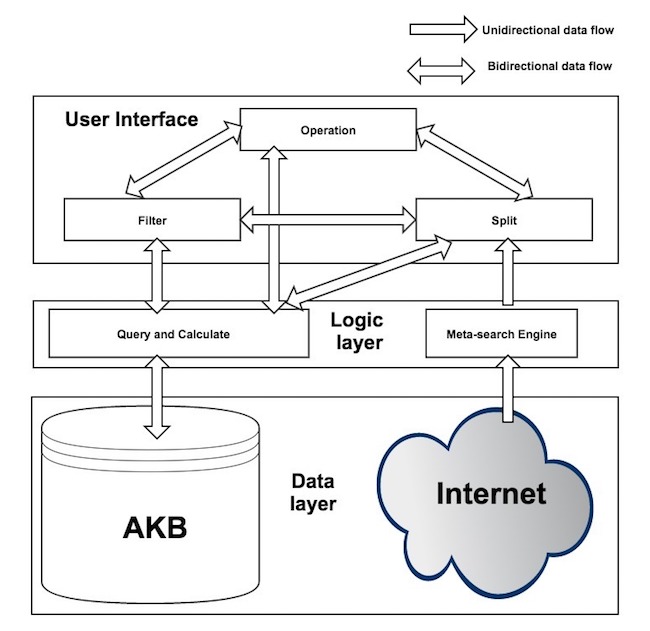
Fig. 2 shows the architecture of ScholarEye. This system consists of three main components: (a) a data layer that provides the data sources; (b) a logic layer that aims to provide supports for a set of visual operations; and (c) a user interface that allows the user to analyze with an intuitive way.
2.1 Data model
In this system, Data layer includes tow parts: (a) academic knowledge base (AKB); (b) open-ended internet resources.
2.1.1 AKB
We have developed an AKB in the previous system. We plan to improve and perfect it based on the previous AKB. We adopt some strategies:
- Adding the properties for entities via Wikipedia and Baidu baike;
- Entity alignment using machine learning;
- Relation extraction through joint reasoning;
2.1.2 Open-ended internet resource
The AKB we developed only consists of academic information. Sometimes, the user needs access to other types of information such as blogs, news, and E-magazine. Considering that the scope of AKB, we plan to provide access to the open-ended internet resource.
2.2 Logic layer
This module aims to provide supports for a set of visual operations and includes two main parts: (a) Query and Calculate , (b) Meta-search engine.
2.2.1 Query and Calculate
The part is mainly charge of dealing with the request of the user interface and the response of AKB. The details are explained in Section 2.3.
2.2.2 Meta-search engine
We plan to embed Google search engine in ScholarEye to extend data sources. When the user enters keywords in the Google search box, the entities that the retrieved results contain can be automatically recognized and labeled using named entity recognition technology. In order to automatically mark named entities, we need insert javascript codes into the response of Google search. There are tow ways: (a)writing a Chrome extension; (b)building an Proxy Server. Currently, we are trying to insert javascript codes through a Proxy Server.
2.3 User interface
This system interface mainly is divided into five main panels, as shown in Fig.3, (a) menu, (b) Google search, (c) split, (d) filter, and (e) operation panels.

2.3.1 Menu
The menu panel (inspired by the Mac OS X dock) provides access to such functions as opening other application panels, saving current analysis status and restoring analysis status.
As shown in Fig.4, there are two sections to the menu panel - the left-hand which deals with applications, and the right-hand side which is where you will find minimized windows. To use an item in the menu panel, click its icon. If you want to open Google search panel, click the Google icon (the icon with letter “G”). When an application is open, the menu panel displays an illuminated background on the application’s icon.

2.3.1 Google search
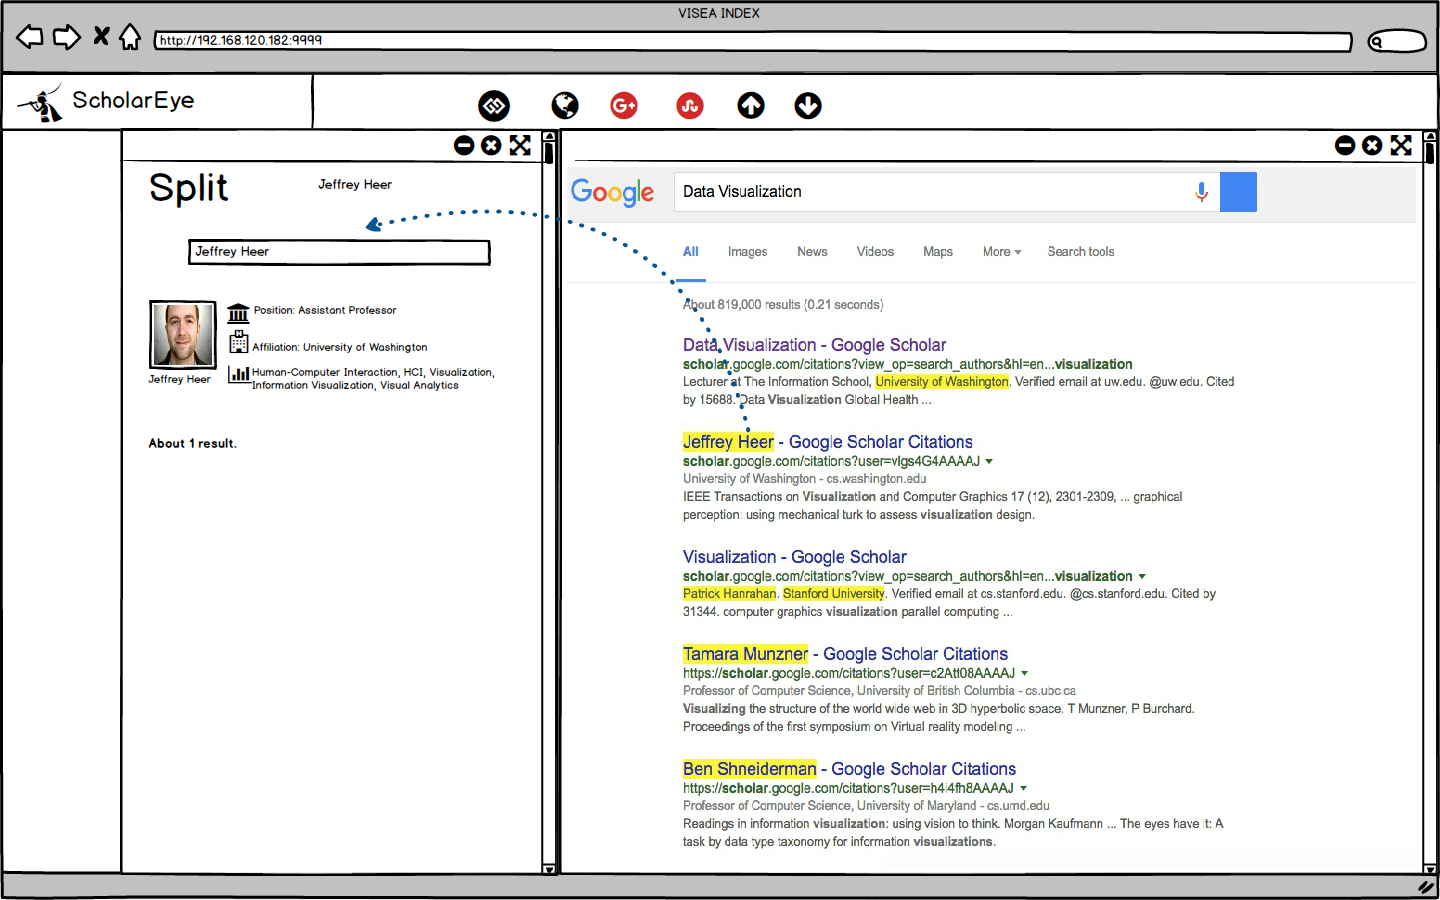
Already mentioned earlier, Google search panel aims to embed Google search engine in this system to extend data sources. As shown in Fig. 5, when the panel is started, it displays Google search interface. The user can enter keywords in the search box to search in the whole Internet. When the results are generated, the named entities in the web page will be automatically marked by setting an background color. Each entity is given a drag-and-drop property, which allows the user to drag entities to the split panel.
2.3.2 Split
The split panel (inspired by TextTile [1] ) displays the entities with the same name. The user can drag-and-drop an entity from the filter, operation, or Google search panel onto the split panel where the different entities stored in AKB with the same name will be exhibited automatically, as shown in Fig. 5.
2.3.3 Filter
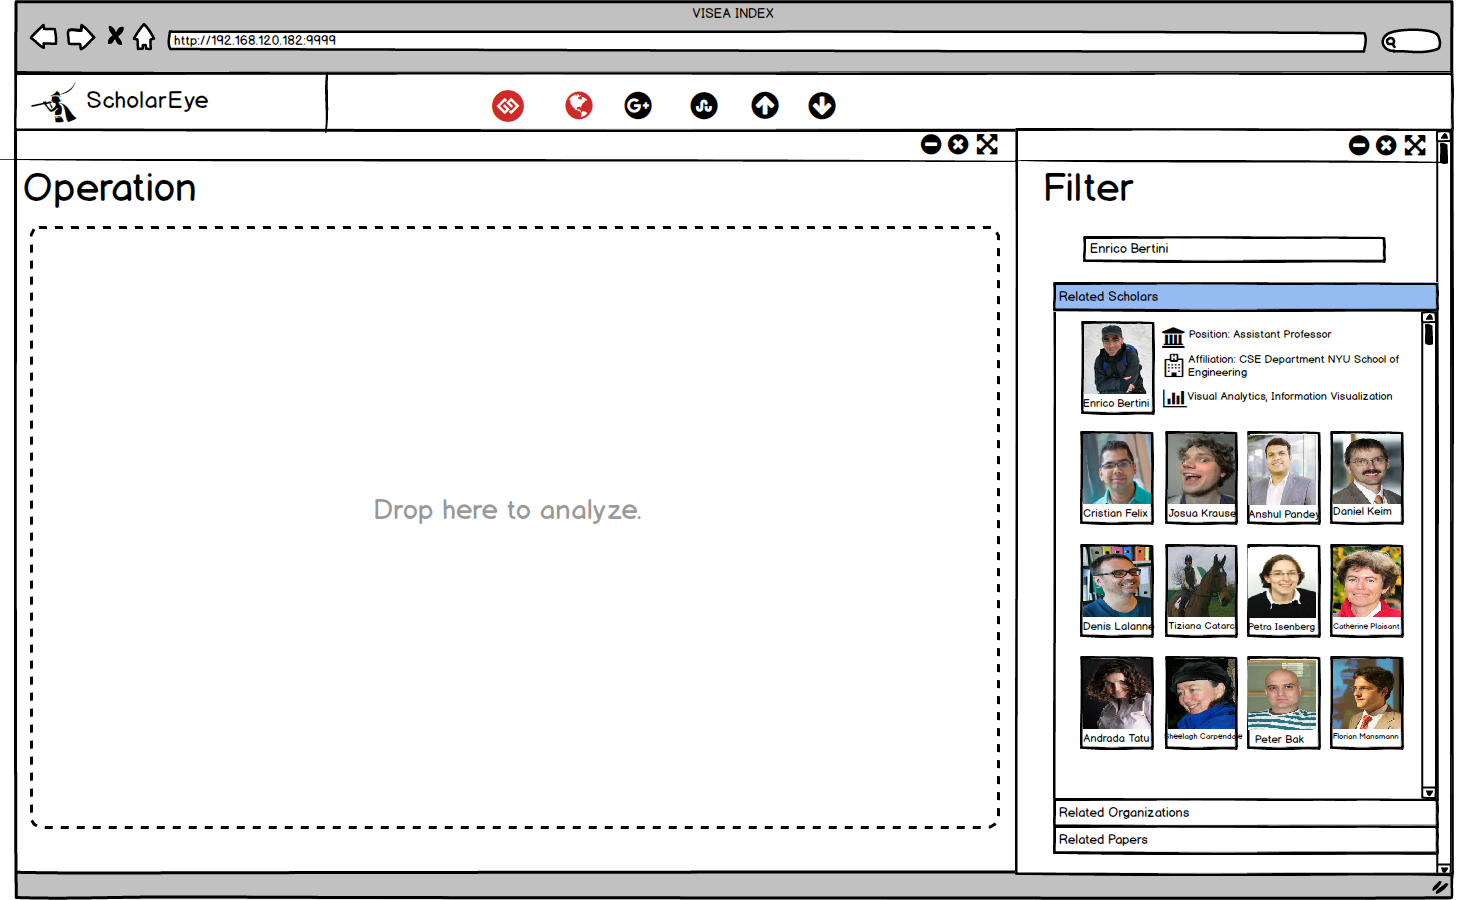
The filter panel provides access for users to retrieve AKB. This panel can accept not only the keywords that the user enters manually but also the entities that are dragged from the operation, split and Google search panel. As shown in Fig. 6, the results are divided into three categories: related scholars, related papers, and related organizations.
2.3.4 Operation
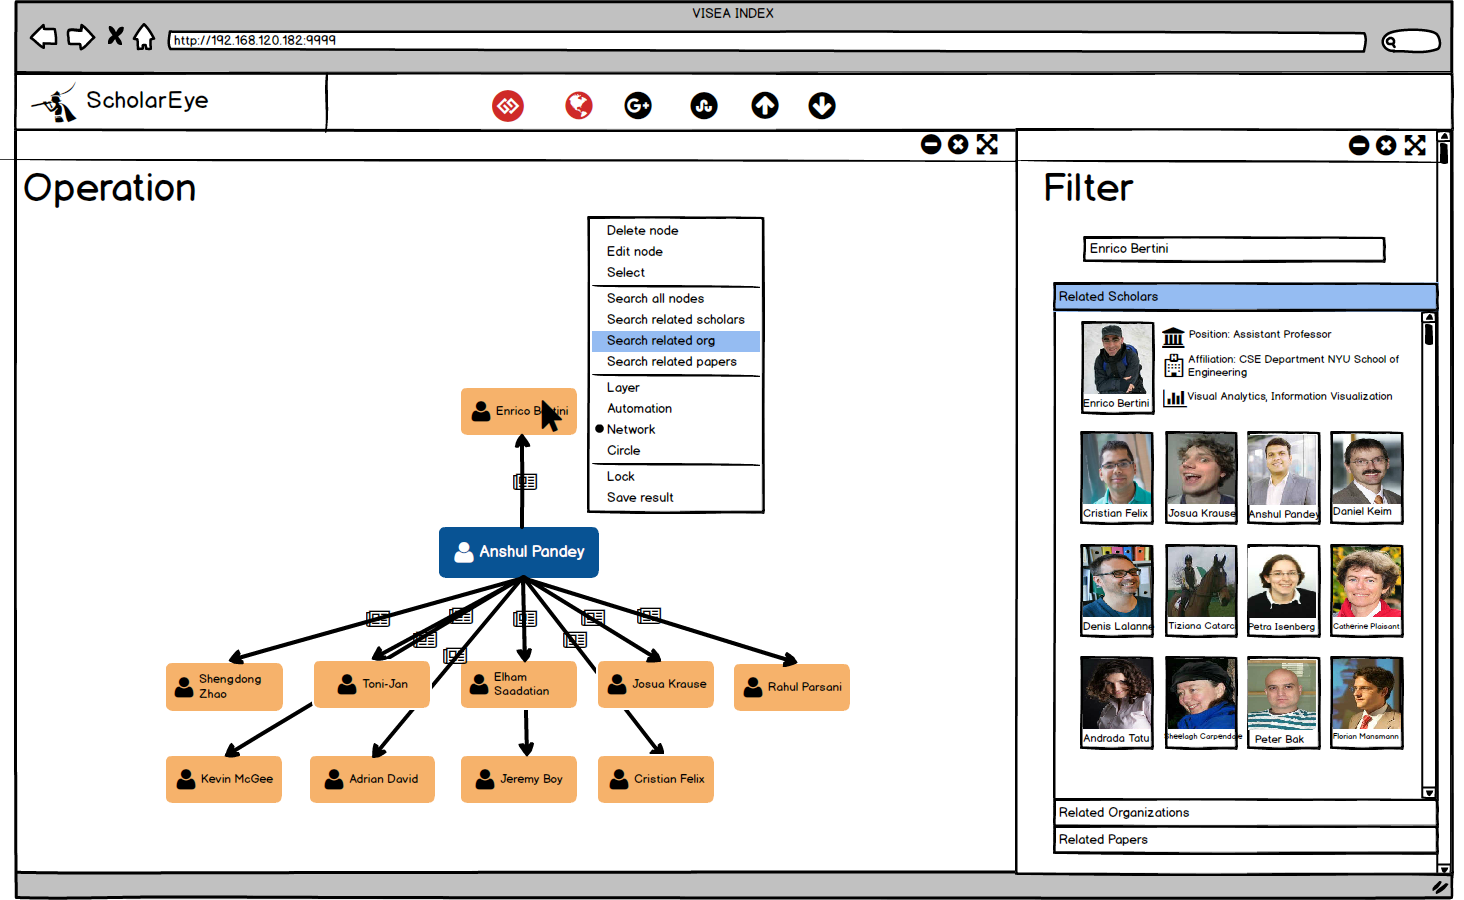
The purpose of the operation panel is to automatically display and analyze the relations between entities. The user can drag-and-drop entities from the filter and split panel onto the operation panel which provides a series of operations, as shown in Fig. 7, to query, analyze and arrange entities.
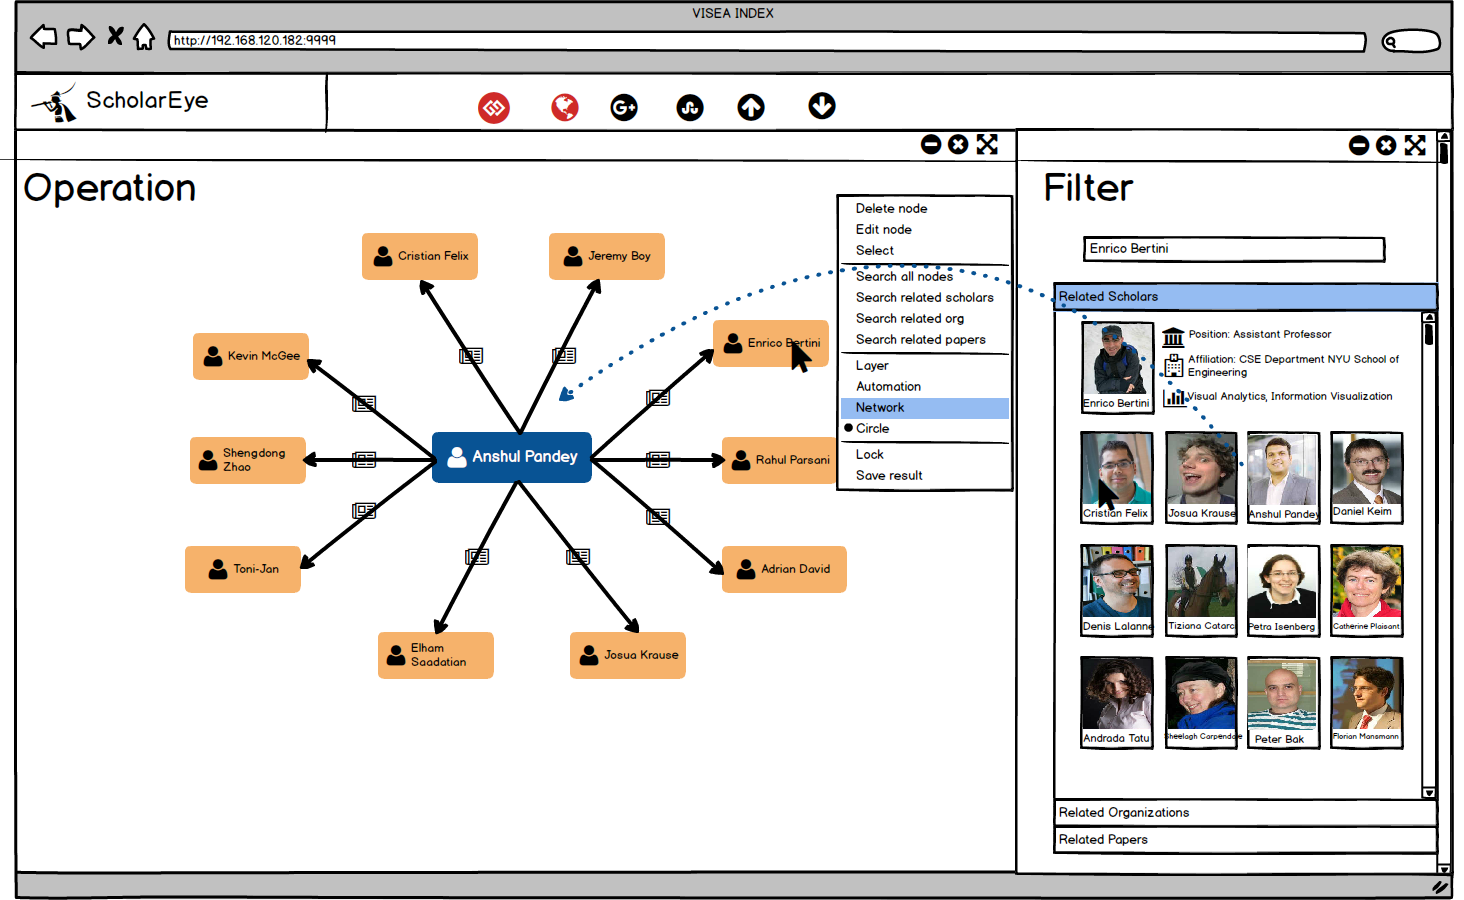
System Demo
This slide displays a demo of the ScholarEye. You can click here to see big pictures.
References
1.TextTile, an Interactive Visualization Tool for Seamless Exploratory Analysis of Structured Data and Unstructured Text
